Edible Wild Plants of the Carolinas
Jump to a genus: A B C D E F G H I J L M N O P Q R S T U V Y
Edible Wild Plants of the Carolinas: A Forager’s Companion now available on the UNC Press website and wherever books are sold!
.png)
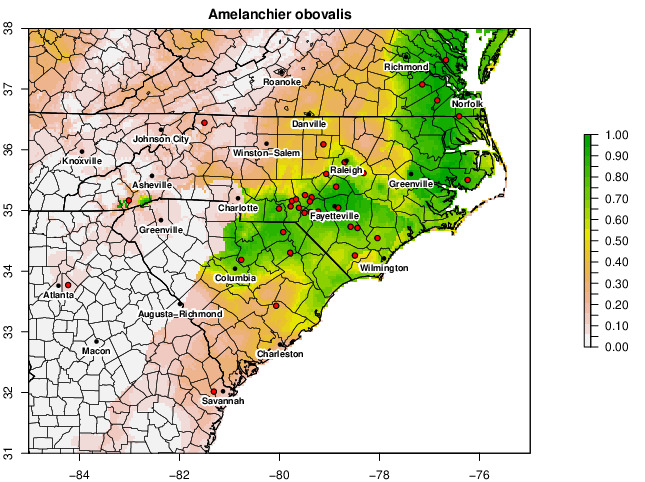
Estimated Distribution Maps
(aka species distribution models, environmental niche models, etc.)
These maps show estimated likelihood of a species' presence across the Carolinas. The color scale ranges from green (1.00) to white (0.0) indicating how likely an area is to be suitable habitat for a species based on a model. Using distribution data from iNaturalist, GBIF, and iDigBio combined with WorldClim bioclimatic variables, the Maxent model infers a likelihood that a species could exist at any point across the landscape. However, many species have few records in the Carolinas or collections only in urban areas, and therefore poor estimations. You can improve these maps by submitting your observations to iNaturalist or getting your herbarium into GBIF/iDigBio!
Something look wrong?
Like all models, these are imperfect representations of the real world. The results are based on presence-only data available in iNaturalist, GBIF, and iDigBio. So if sample sizes are small or disproportionately collected in certain areas, the map will probably not represent a species' actual distribution very well. Also, the only landscape variables are climatic, so there isn't information about things like soils, hydrography, or topography. Niches are modelled across a species entire range, so if a plant is found more broadly outside our region that may skew its likelihood of occurrence in the Carolinas. Finally, while some sampling bias was alleviated by removing occurrences within 5 miles of each other, most data points are concentrated around still cities.
But you can fix it! Get out in the field and find these tasty treats. Make observations in undersampled areas and submit them to iNaturalist, or correct an identification if something looks out of place. The GBIF and iDigBio websites have records that link to herbarium specimens, so you can find if a sheet needs reannotation.
Last updated: 18 November 2023
A
B
C
D
E
F
G
H
I
J
L
M
N
O
P
Q
R
S
T
U
V
Y
Methods
For each species, up to 5000 records with geographic coordinates are downloaded from each of GBIF, iDigBio, and iNaturalist. For iNaturalist, only research-grade records are used. These data are combined and filtered with CoordinateCleaner, removing common errors including coordinates placed at country capitals or centroids, at biodiversity institutions, or in the ocean. Then, the spThin algorithm finds and removes the minium number of records so that none are within 5 miles of each other. This thinning reduces some sampling bias, but does not eliminate it as collections still tend to be concentrated around cities. The cleaned coordinate data are input into the Maxent model, along with 19 BIOCLIM bioclimatic variables, in order to find which variables best explain a species' presence. Finally, this model is applied across the landscape to calculated the likelihood that a species might occur at a given location. The prediction is plotted to highlight the Carolinas, but the model inference occurs across a species' entire range.
See the code used to generate these maps: https://github.com/pschafran/Carolina-Edible-Plants/
Many resources were used in creating these maps, especially the R packages: CoordinateCleaner, dismo, maps, raster, rgbif, rgdal, rgeos, ridigbio, rinat, rJava, sf, sp, spThin
Notes
Names marked with an asterisk indicate a change in the name of a species as used in the book. The name at the top of the map is the one used to search the databases.


